Financial Ratios
The financial ratios calculated on this spreadsheet are the same financial ratio tracked by the Risk Management Association (RMA) Statement Studies.
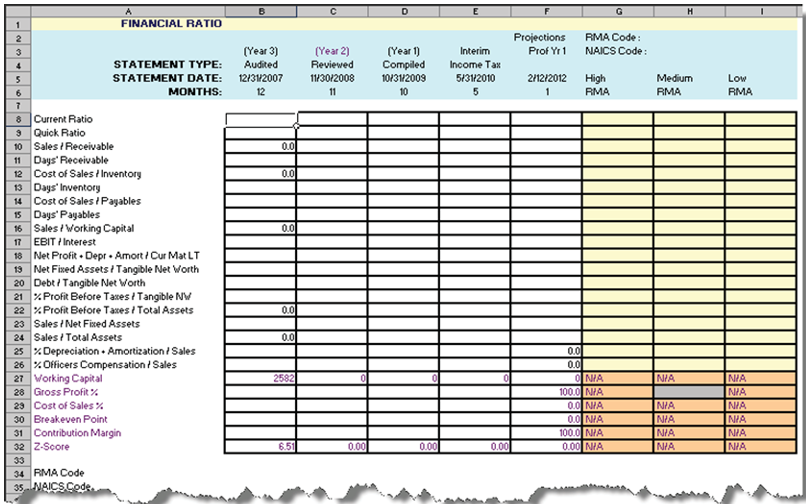
The following table provides a brief definition for each ratio.
| Ratio | Definition |
|---|---|
| Liquidity Ratios | |
| Current Ratio | Total Current Assets / Total Current Liabilities |
| Quick Ratio | (Cash & Equivalents + Trade Receivables) / Total Current Liabilities |
| Sales/Receivables | Net Sales / Trade Receivables |
| Days/Receivables | 365 / (Sales/Receivables) |
| Cost of Sales/Inventory | Cost of Sales / Inventory |
| Days Inventory | 365 / (Cost of Sales/Inventory) |
| Cost of Sales/Payables | Cost of Sales / Payables |
| 1 Days Payable | 365 / (Cost of Sales/Payables) |
| Sales/Working Capital | Net Sales / Net Working Capita |
| Coverage Ratios | |
| Earnings before Interest and Taxes (EBIT)/Interest | Earnings Before Interest & Taxes / Annual Interest Expense |
| Net Profit + Depreciation, Depletion, Amortization/ Current Maturities Long-Term Debt | (Net Profit + Depreciation + Amortization Expenses) / Current Portion of Long-Term Debt |
| Leverage Ratios | |
| Fixed Assets / Tangible Net Worth | Net Fixed Assets / Tangible Net Worth |
| Debt / Tangible Net Worth | Total Liabilities / Tangible Net Worth |
| Operating Ratios | |
| % Profits Before Taxes/Tangible Net Worth | (Profit Before Taxes / Tangible Net Worth) x 100 |
| % Profit Before Taxes/Total Assets | (Profit Before Taxes / Total Assets) x 100 |
| Sales/Net Fixed Assets | Net Sales / Net Fixed Assets |
| Sales / Total Assets | Net Sales / Total Assets |
| Expense to Sales Ratios | |
| % Depreciation, Depletion, Amortization/Sales | ((Depreciation + Amortization + Depletion Expenses) / Net Sales) x 100 |
| % Officers, Directors, Owners' Compensation/Sales | ((Officers' + Directors + Owners' Compensation) / Net Sales) x 100 |
Note the following:
- The Statement Type, Statement Date and Months headers are automatically populated by information in the Spread Setup tab and cannot be edited.
- If an applicable RMA code was chosen in TSoftPlus, you are able to enter information in High RMA, Medium RMA, Low RMA (columns G, H, I): RMA data.
- RMA Code - populates from RMA Code chosen in TSoftPlus on the NAICS screen on the Eligibility tab.
- NAICS Code - populates from NAICS Code chosen in TSoftPlus on the NAICS screen on the Eligibility tab.
- Description - populates from NAICS Code Description chosen in TSoftPlus on the NAICS screen on the Eligibility tab.
Note:
If all zeros (0) appear in the RMA columns, an RMA did
not receive enough information for the SIC Code and Sizes Standard. To resolve, try
one of the following:
- Use Sales as the base method versus Assets and vice-versa.
- Try changing the base year.