Inquiries Graph
Inquiries Graph
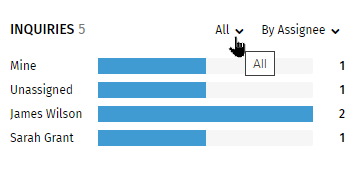
The Inquiries graph displays information about inquiries including counts by assignees, time, and type. The default view for the graph displays all inquiries by all assignees.
The graph can be customized by selecting options in the lists.
- In the first list, select All, Mine, or Unassigned.
- In the second list, select By Time, By Type, or By Assignee.
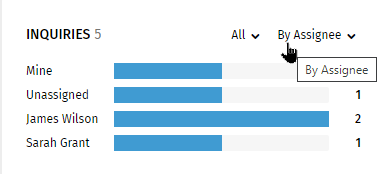
- Select By Time to display inquiries made during the previous seven days (from the start of seven days ago to current time), and Older (inquiries older than the end of the seventh day-eight days ago or longer).
- Select By Type to display inquiries for a specific line of business.
- Select Assignee to display inquiries assigned to yourself (Mine), specific people (in alphabetical order), or unassigned.
Note:If inquiries do not exist for the selected criteria, the graph will not display the bar related to the criteria. Example: If you do not have inquiries assigned to yourself, the graph section will be empty when Mine is selected.
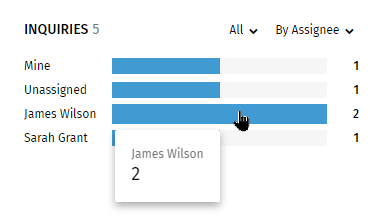
Viewing Details on the Graph
Note:
If you have different lines of business
(Example: Consumer, Commercial, or Mortgage), the bars on the graph
segments will display in different colors.
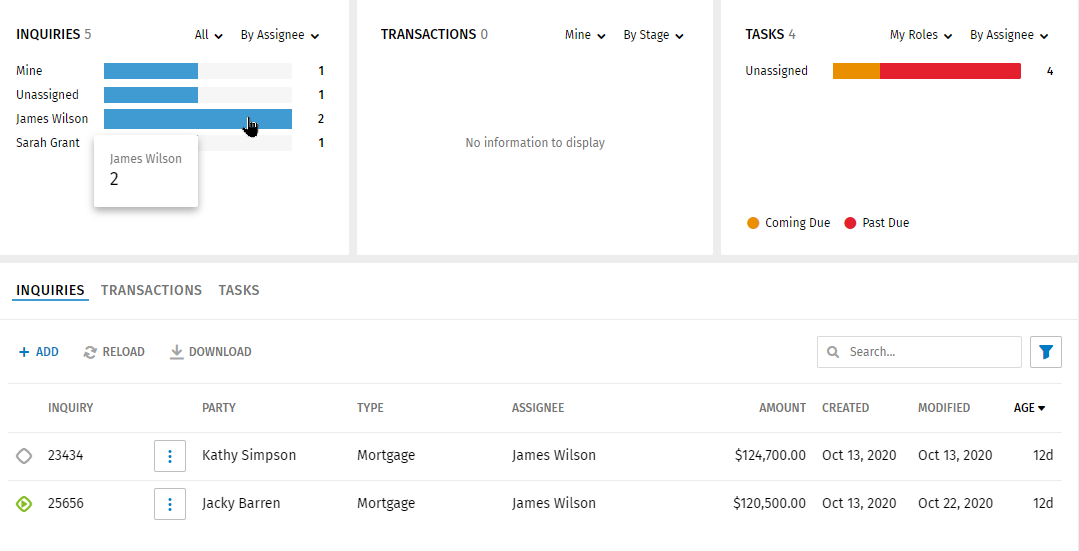
Pause your cursor over a color/section on the graph to view details.
Graph Selection and Grid Display
Select a color/section on the graph to displays inquiries for the section/color in the grid. Example: Selecting James Wilson in the graph above displays all the inquiries assigned to James Wilson.