Executive View
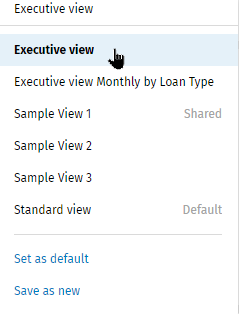
The Executive view includes the Overview, Pending Decisions, and Pipeline sections. Select Executive View in the Views list to access this view.
Overview
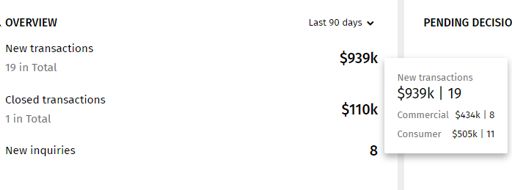
- The Overview section displays the total amount and counts of new and closed transactions and the number of new inquiries.
- The closed transactions amounts are based on the closing date.
- The inquiries amounts are based on the created date.
- The amounts can be defined by time options: Today, Last 7 days, Last 30 days, and Last 90 days.
- Pause your cursor over an amount to display details.
Pending Decisions
- The Pending Decisions section display all decisions assigned to the person signed on so a user can easily view decisions, access a specific decision, and complete the decision.
- The decisions can be defined by SLA options: Past Due, Coming Due, On-time.
- Selecting a task on the colored/section on the graph opens the Transactions grid.
Leaders
- The total amounts and counts of transactions display.
- The amounts can be defined by Loan Officers or by Organization.
- The amounts can also be defined by time options: Today, Last 7 days, Last 30 days, and Last 90 days.
- Pause a cursor over a colored line/section in the graph to displays details.
- Selecting a colored/section on the graph opens the Transactions grid.
Pipeline
- The Pipeline graph displays the total amount of transactions in the pipeline.
- The amounts can be defined by list options (By Type, By Credit Types, By Loan Officer, By Organization, By Stage, and None.
- The amounts can also be defined by time options (Weekly, Monthly, and Quarterly).
- Selecting a colored/section on the graph opens the Transactions grid.