Graph Format
The Pipeline graph format displays the totals of processes in a graphical format.
- To view the graph format, select Reports in the left pane and
select Pipeline. Select
 .
. - Filtering
- Select options in the Filter Types pane. Select Filter Types for Help information.
- Select options in the Split By and Show lists to filter the report by assignee, role, hours, and/or tasks.
- Reloading: Select
 to update the graph with current
information.
to update the graph with current
information.
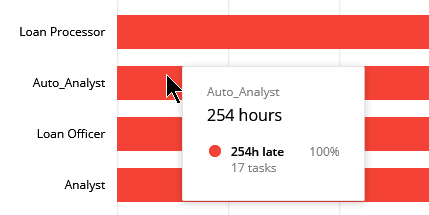
Note:
Pause your cursor over a horizontal line in the graph to display details at
a glance. The details will display according to the selections made in the
Split by and Show lists. The image below displays details for a horizontal
line when Role and Hours were selected in the lists.